In every mathematical course, or any course in general especially the advanced ones, there is always some particular concept the we first need to cover before we can confidently start the course. In calculus, the basic notion that we first need to fully grasp are functions. Functions have been present from algebra to analytic geometry. Almost all basic mathematics have already incorporated functions even without knowing what functions really are. Hence, starting our lesson with functions and grasping its concept will not be that complicated.
A function is a special relationship between an input and an output, where the value of the output depends on the value of the input, given that for every input there can only be one output. Imagine the function as a juicer, if you use it on an apple you cannot expect a different type of juice other than an apple juice (Figure 1). With this in mind, replacing the fruit will result to a different juice.
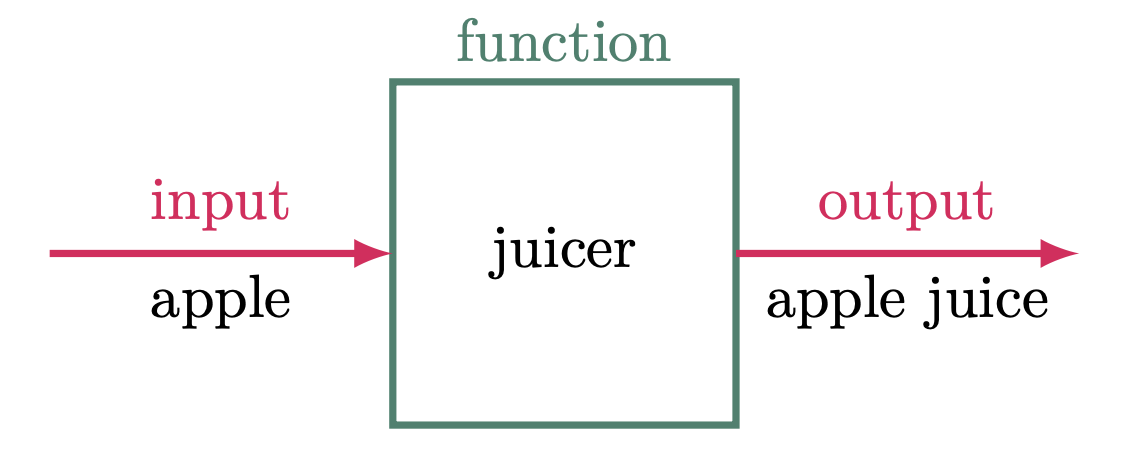
Figure 1: Relating a function as a fruit juicer
Functions can be expressed in various ways, including symbolic representations, equations, tabular representations, graphs, and even phrases. Figure 1 is an example of a symbolic representation of a function, relating this to an equation, for example $y = 2x + 1$. The variable $x$ is our apple (input), $y$ is the apple juice (output) and $2x+1$ is the juicer (function). The function tells us what to do to our input in order to end up with the resulting output. As a result, we get a value for $y$ for every value we replace $x$ with.
$\example{1}$ Solve for $y=2x+1$, if $x=5$.
$\solution$
Replace $x$ with 5 to the equation,
\[\begin{align*} y &= 2x+1 \\ &= 2(5)+1 \\ &= 10+1 \\ &= 11 \tagans \end{align*}\]Hence, if the input is 5 then the output of the function is 11
Phrases are another way of representing functions. For instance, “there are two oranges for every apple,” Another way to express this is to use a tabular representation of a function by assigning values to the input and solving for the values of the output (see Table 1).
Table 1: Number of oranges with respect to the number of apples
\[\begin{array}{cc} \hline \text{apple }(x) & \text{orange }(y) \\ \hline 1 & 2 \\ 2 & 4 \\ 3 & 6 \\ 4 & 8 \\ 5 & 10 \\ \hline \end{array}\]Furthermore, we can still extend this and visualize the function by plotting it in a graph (Figure 2).
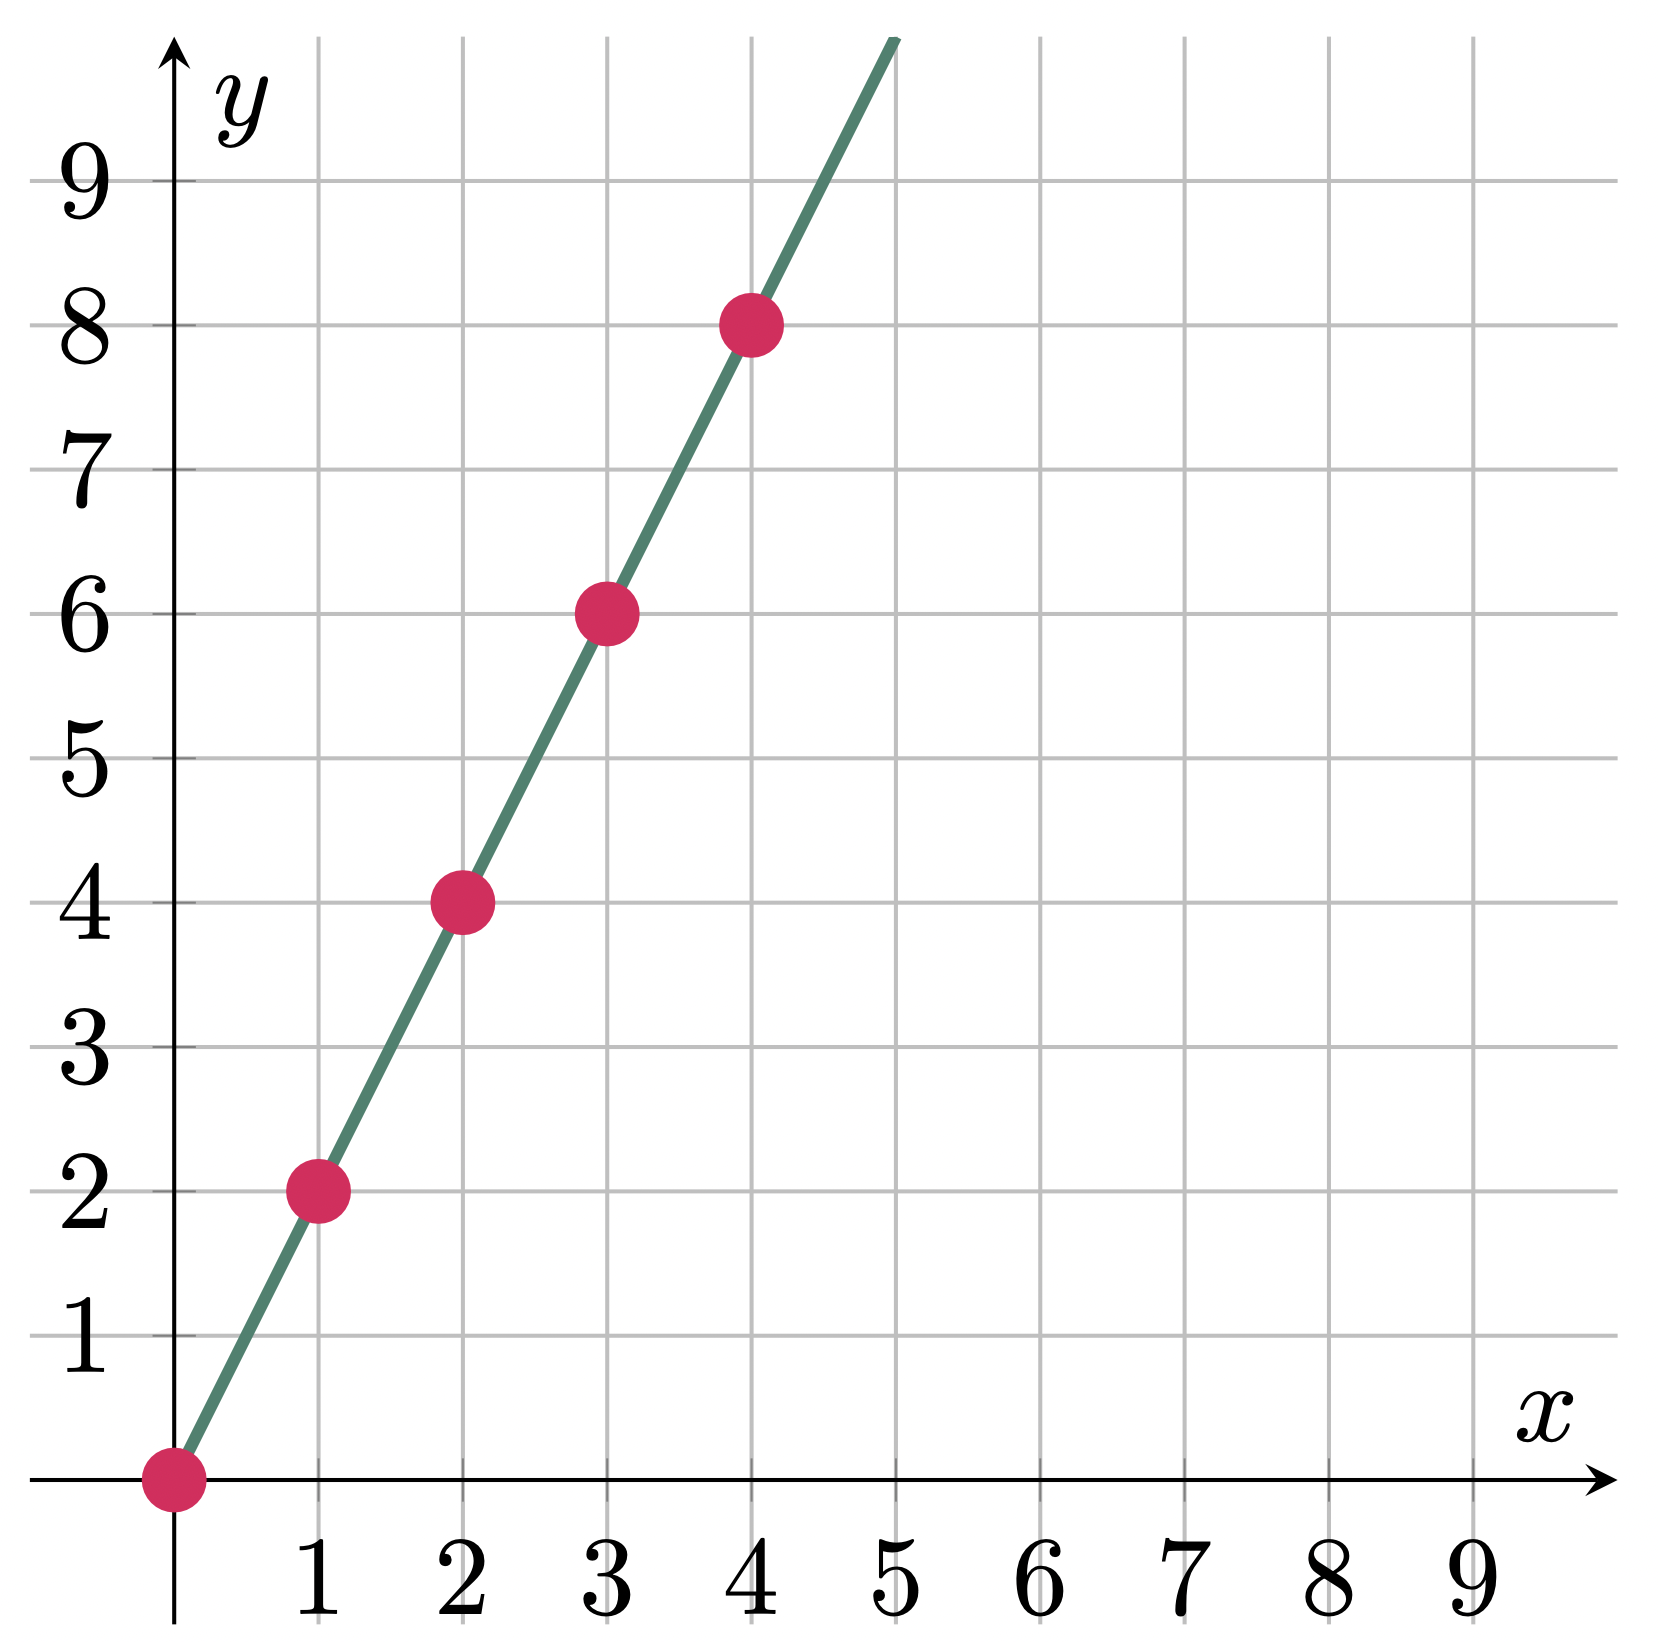
Figure 2: Graphical representation of Table 1
Nonetheless, we can represent it in an equation form by assigning variables to both the orange and the apple, say $x$ and $y$, respectively.
\[\begin{align*} \text{orange} &= 2(\text{apple}) \\ y &= 2x \end{align*}\]As you may have noticed, functions can appear in several forms. Despite these varied representations, their primary purpose remains the same: to describe the relationships between different factors. In calculus, we will focus primarily on expressing these relationships using equations and, to a significant extent, their graphical representations.
Dependent and Independent Variables
Variables are symbols or letters used to represent an unknown value. The dependent variable on a function represents a quantity that depends on the value given to the independent variable. The symbol “$x$” is usually used to describe the independent variable (input) and “$y$” for the dependent variable (output).
Determining the dependent and the independent variable of an equation is crucial since choosing the other way around may result in an equation that does not represent a function. Furthermore, this is highly useful, especially in applications such as Optimization and some Physics notions. For instance, in kinematics, an equation is given that describes the position “$s$” of an object at a given time “$t$”. Since the position $s$ varies with respect to time $t$, not the other way around, then $t$ must be the independent variable and $s$ the dependent variable. Moreover, it is good to note that if time is one of the variables, it is most likely to be the independent variable since time is consistent.
In graphing a function, the independent variable is placed at the horizontal axis and the dependent variable on the vertical axis.
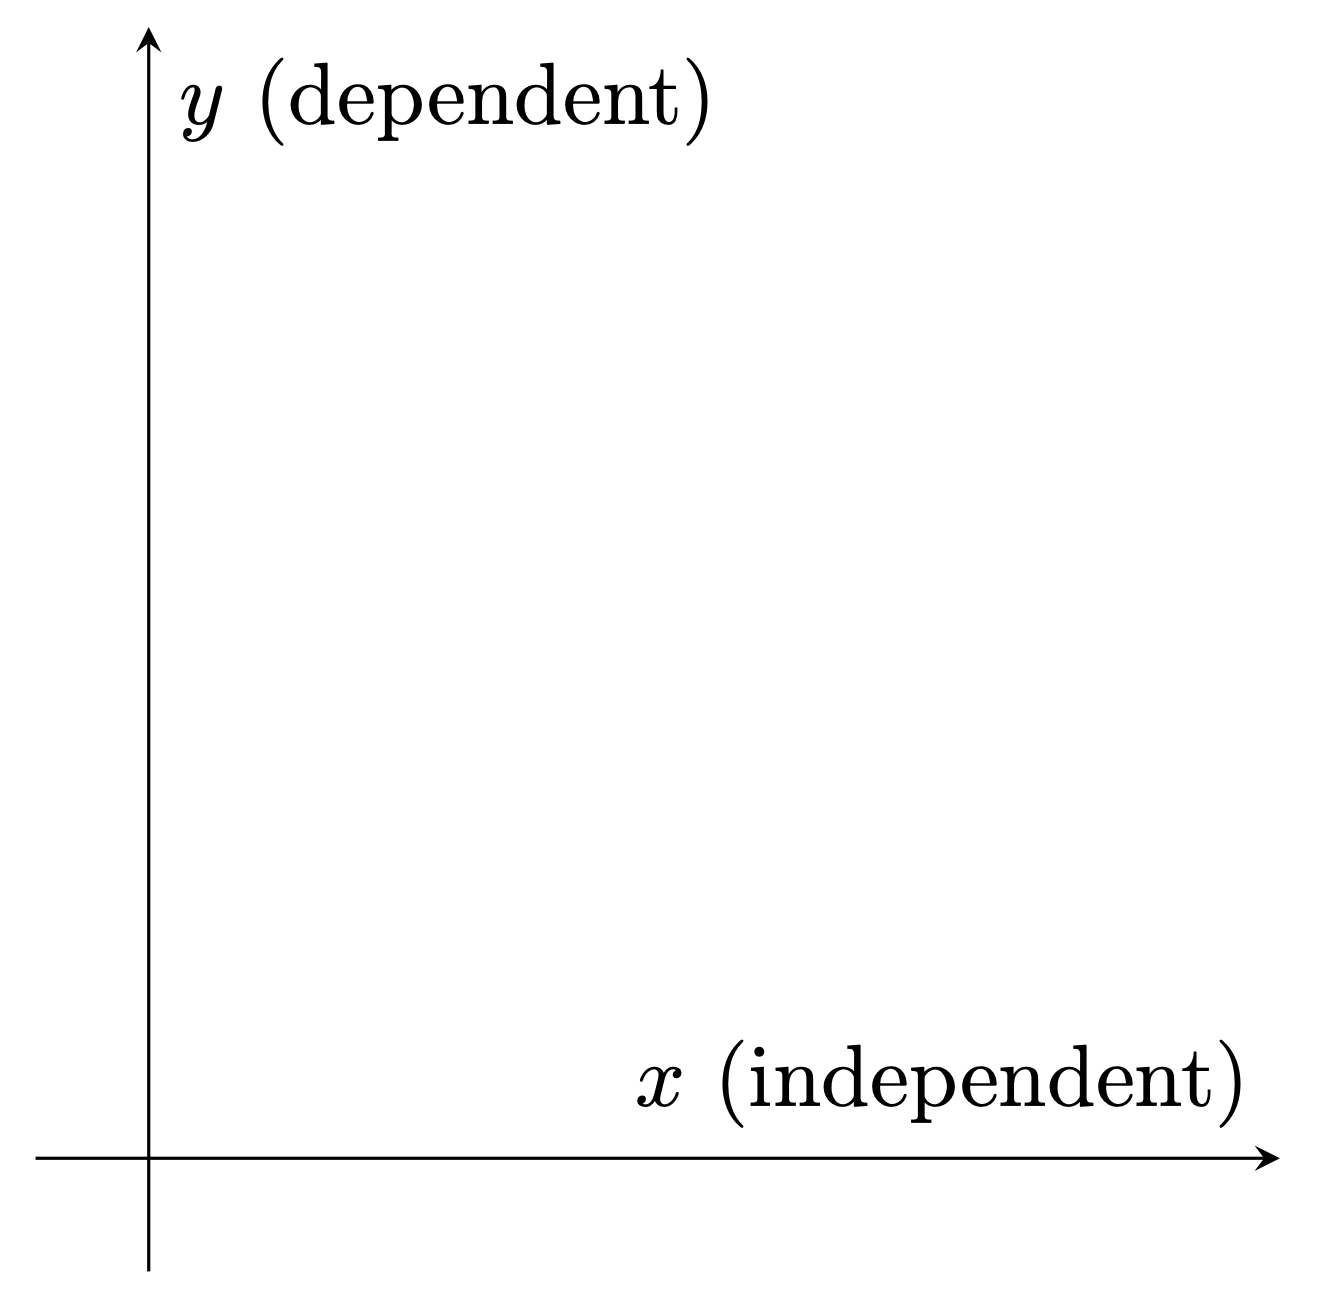
Figure 3: Placement of the dependent and the independent variable in a graph
Determining if an Equation Represents a Function or Not
here are several ways to determine if an equation represents a function. However, in our case, we can use the definition of a function to determine whether or not an equation represents a function. One of the simplest methods is the Substitution Method, where we substitute a value for the independent variable and see if it produces a single output value. Since each input can only have one output in a function, having two or more solutions for the same input indicates that the equation does not represent a function. To understand this, let’s look at some examples.
$\example{2}$
Determine if the following equations represent a function:
a. $y=2x^2+1$
b. $y=\sqrt{x+3}$
c. $y^2=x+3$
$\solution$
$\For{a}$
For an equation to be considered a function, there must only be one output for every input. So for instance, if we replace $x$ with 1,
The output is 3. And even if we replace $x$ with any value, there is only one possible output, therefore $y=2x^2+1$ is a function.
$\For{b}$
In testing if an equation is a function, we can substitute any value for the independent variable. However, it is crucial to replace it with a value that we can easily simplify. Otherwise, it will utterly complicate the solution. For this example, let’s try substituting $x$ with 6:
When we replace $x$ with 6, we get a single value $y = 3$. This is likely true if we replace $x$ with any value within the range where the square root is defined ($y$ has a real value). For the function to give a valid value of $y$, the result of the expression inside the square root must be non-negative (i.e., $x \geq -3$). Nonetheless, $y = \sqrt{x+3}$ is considered a function.
Note that the output is only positive, and not $\pm 3$, since we are referring to the principal square root. This might seem to contradict the fact that the result of a square root can be both positive and negative. However, this only happens in equations where the variable is originally squared. To understand this better, let’s take a look at the next example.
$\For{c}$
This might seem similar to the previous example, but here we focus on the dependent variable $y$. Since $y$ is squared, replacing $y$ with either a positive or negative value will result in the same value. For instance, 2 and $-2$; squaring either of these will result in 4. Thus, when we isolate $y$ by taking the square root of both sides of the equation, we need to indicate a $\pm$ symbol to represent both possible values:
If $x = 6$,
\[\begin{align*} \phantom{y^2} &= \pm\sqrt{9} \\ &= \pm3 \end{align*}\]Thus, if $x=6$, $y$ can be either $3$ or $-3$. This means that for a single input $x$, we can have two possible outputs. Hence, $y^2=x+3$ is not a function