This topic may have been covered in previous prerequisite courses, specifically in Analytic Geometry. As you may have already learned, there are numerous methods for plotting a graph from an equation. However, if you have forgotten how to do so, we will utilize the simplest method, which is by plotting multiple points on a Cartesian plane and then tracing them to form a line or a curve. While this method might not be convenient for graphs that you are already familiar with (e.g., lines and conic sections), it can be particularly useful for more complicated functions. The downside of this method is that it can be a bit time-consuming, especially for complex graphs.
To demonstrate this, let’s start with what we have already established previously. We have a clear notion that functions can be represented in different forms, such as equations, graphs, and even tables. So, if we have a function $f(x) = x^2$, we can first tabulate it by assigning values to $x$ and solving the value of $y$.
\[\begin{array}{c|rrrrrrr} x & -3 & -2 & -1 & 0 & 1 &2 &3 \\ \hline f(x) & 9 & 4 & 1 & 0 & 1 & 4 & 9 \end{array}\]These tabulated values can now be plotted on a Cartesian plane, where the input (independent variable) lying on the horizontal axis and the output (dependent variable) on the vertical axis. Hence, connecting the points will then form the curve, which represents the graphical form of the function $f(x) = x^2$.
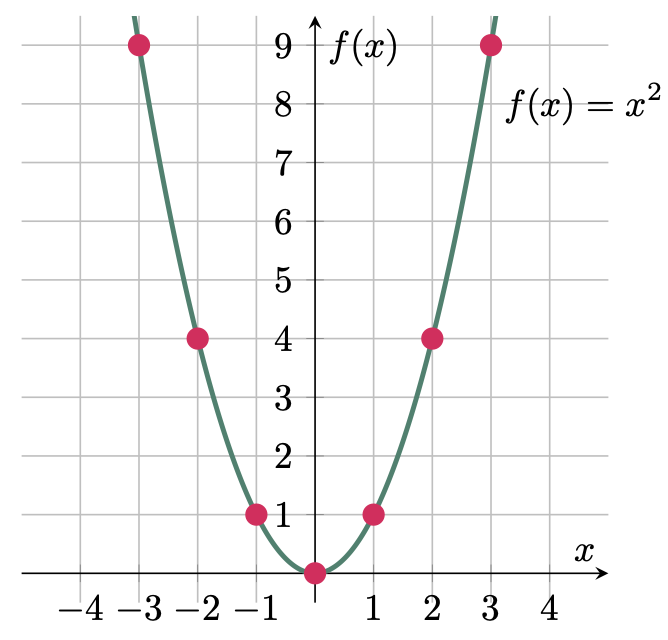
Figure 1: Graphical representation of $f(x)=x^2$
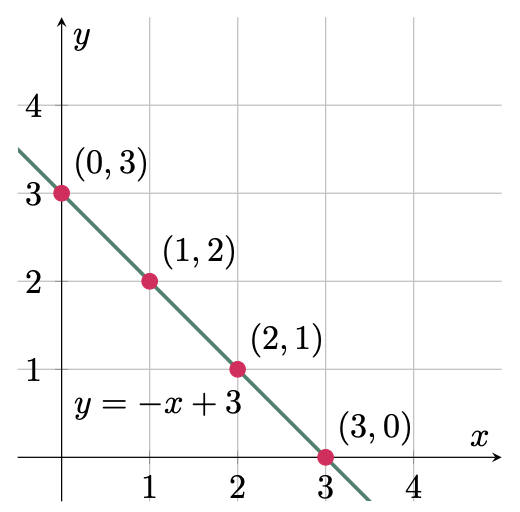
$\example{1}$ Graph the equation of the line $y=-x+3$
$\solution$
There are a lot of ways of plotting a graph in a cartesian plane, but one of the simplest method is by assigning values to the independent variable, which in this case is $x$,
\[\begin{array}{c|cccc} x & 0 & 1 & 2 & 3 \\ \hline y & 3 & 2 & 1 & 0 \end{array}\]Trace the points on the cartesian plane after plotting them.
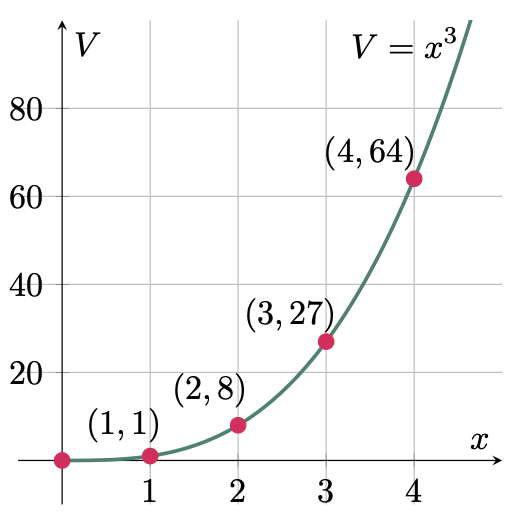
$\example{2}$ Express the volume of a cube as a function of the length of its edge. Graph the function.
$\solution$
$\text{Let: } V = \text{volume of the cube} $
$\phantom{\text{Let: }} x = \text{length of an edge of the cube}$
Hence, the equation for the volume of a cube is,
\[\begin{align*} V &= x^3 \tagans \end{align*}\]Assign values to $x$, then tabulate the result,
\[\begin{array}{c|ccccc} x & 0 & 1 & 2 & 3 & 4\\ \hline V & 0 & 1 & 8 & 27 & 64 \end{array}\]Plot the points on the cartesian plane,
$\example{3}$ Express the length of the edge of a cube as a function of its volume. Graph the function.
$\solution$
$\text{Let: } V = \text{volume of the cube} $
$\phantom{\text{Let: }} x = \text{length of an edge of the cube}$
Hence, the equation for the volume of a cube is,
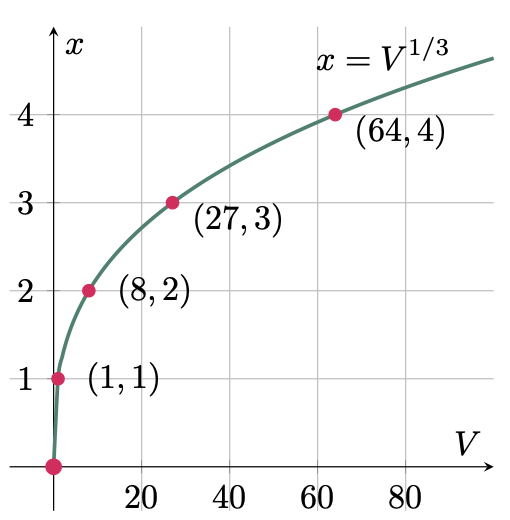
\[V = x^3\]Then express the length of the edge as a function of its volume, \(x = V^{1/3} \tagans\)
Assign values to $V$, then tabulate the result,
\[\begin{array}{c|ccccc} V & 0 & 1 & 8 & 27 & 64\\ \hline x & 0 & 1 & 2 & 3 & 4 \end{array}\]Plot the points on the cartesian plane,
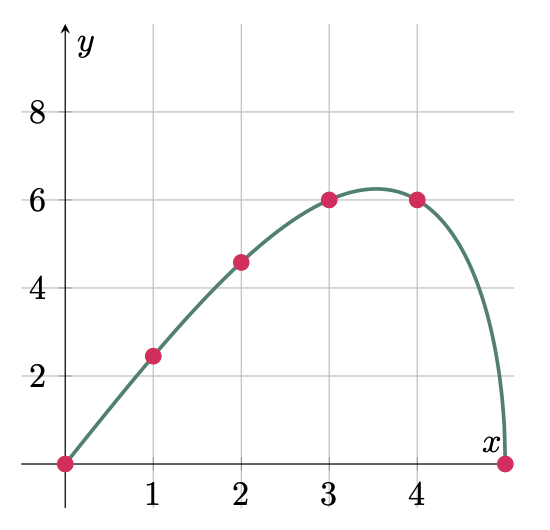
$\example{4}$ A right triangle has a hypotenuse of 5 cm. Express its area as a function of its base. Graph the function.
$\solution$
$\text{Let: } A = \text{area} $
$\phantom{\text{Let: }} a = \text{altitude}$
$\phantom{\text{Let: }} b = \text{base}$
$\phantom{\text{Let: }} c = \text{hypotenuse}$
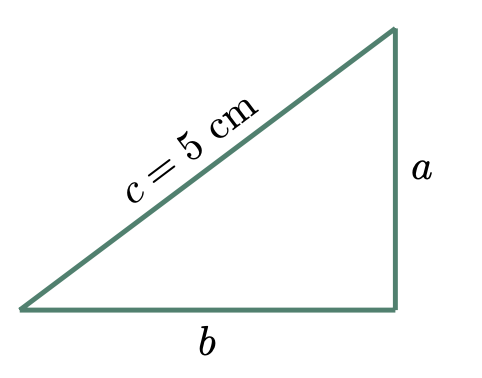
We can solve for the altitude $a$ of the triangle using the Pythagorean theorem,
\[\begin{align*} c^2 &= a^2 + b^2 \\ a^2 &= c^2 -b^2 \\ a &= \sqrt{5^2-b^2} \\ &= \sqrt{25-b^2} \end{align*}\]Solving for the area will give us,
\[\begin{align*} A &= \frac{1}{2} ab \\ A &= \frac{1}{2} b\sqrt{25-b^2} \tagans \end{align*}\]Assign values to $b$, then tabulate the result,
\[\begin{array}{c|cccccc} b & 0 & 1 & 2 & 3 & 4 & 5\\ \hline A & 0 & 2.45 & 4.58 & 6 & 6 & 0 \end{array}\]Plot the points on the cartesian plane,